
We would like to thank Voltage Park, Dell, H5, and NVIDIA for their invaluable partnership and help with setting up our cluster. A special thanks to Ozan, Melissa, Drew, Michael, and David at Voltage Park for their dedicated support throughout the project. Setting up a cluster of this size is an enormous challenge and we couldn’t have done it without them.
This is the second of a three-part series on how we trained our 70B model. We covered setting up infrastructure, conducting evaluations, and hyperparameter optimization.
Introduction
In the span of a few months, with a small team of researchers and engineers, we trained a 70B parameter model from scratch on our own infrastructure that outperformed zero-shot GPT-4o on reasoning-related tasks.
Today, we’re sharing an end-to-end guide for setting up the required infrastructure: from bringing up the initial cluster and installing the OS, to automatically recovering from errors encountered during training. In each step, we detail the challenges we encountered and how we resolved them. Along with our learnings, we’re releasing many of the infrastructure scripts we developed to ensure healthy hosts, so that other teams can more easily create stable infrastructure for their own model training.
Along with our detailed process, we are releasing:
- Host-level health checks: scripts to ensure that a given host is free from known errors
- An NVIDIA Collective Communication Library (NCCL) patch that improves logging around errors and stalls
- A stress test to confirm that GPUs are able to allocate large tensors and perform standard operations
- Networking tests to check that the GPUs on a given machine are able to communicate with each other (via NVLink) and with GPUs on other machines (via InfiniBand)
- A script which parses the Unified Fabric Manager (UFM) event log, checks for relevant events, and determines which network ports should be disabled
- A script which generates a comprehensive burn-in workload for InfiniBand fabrics, aiming to exercise every available link
Throughout the process, members of our engineering team worked with our partners at Voltage Park to prepare the cluster for production use. The full process involved:
- Provisioning individual machines
- Provisioning InfiniBand
- Ensuring fully healthy machines
- Diagnosing common training issues
- Improving infrastructure tooling
Each of these steps is described in greater detail below.
Background: How this is supposed to work
The purpose of our compute was to enable rapid experimentation with large-scale language models. To do this, we needed a large number of fast GPUs that could communicate with each other at high speeds.
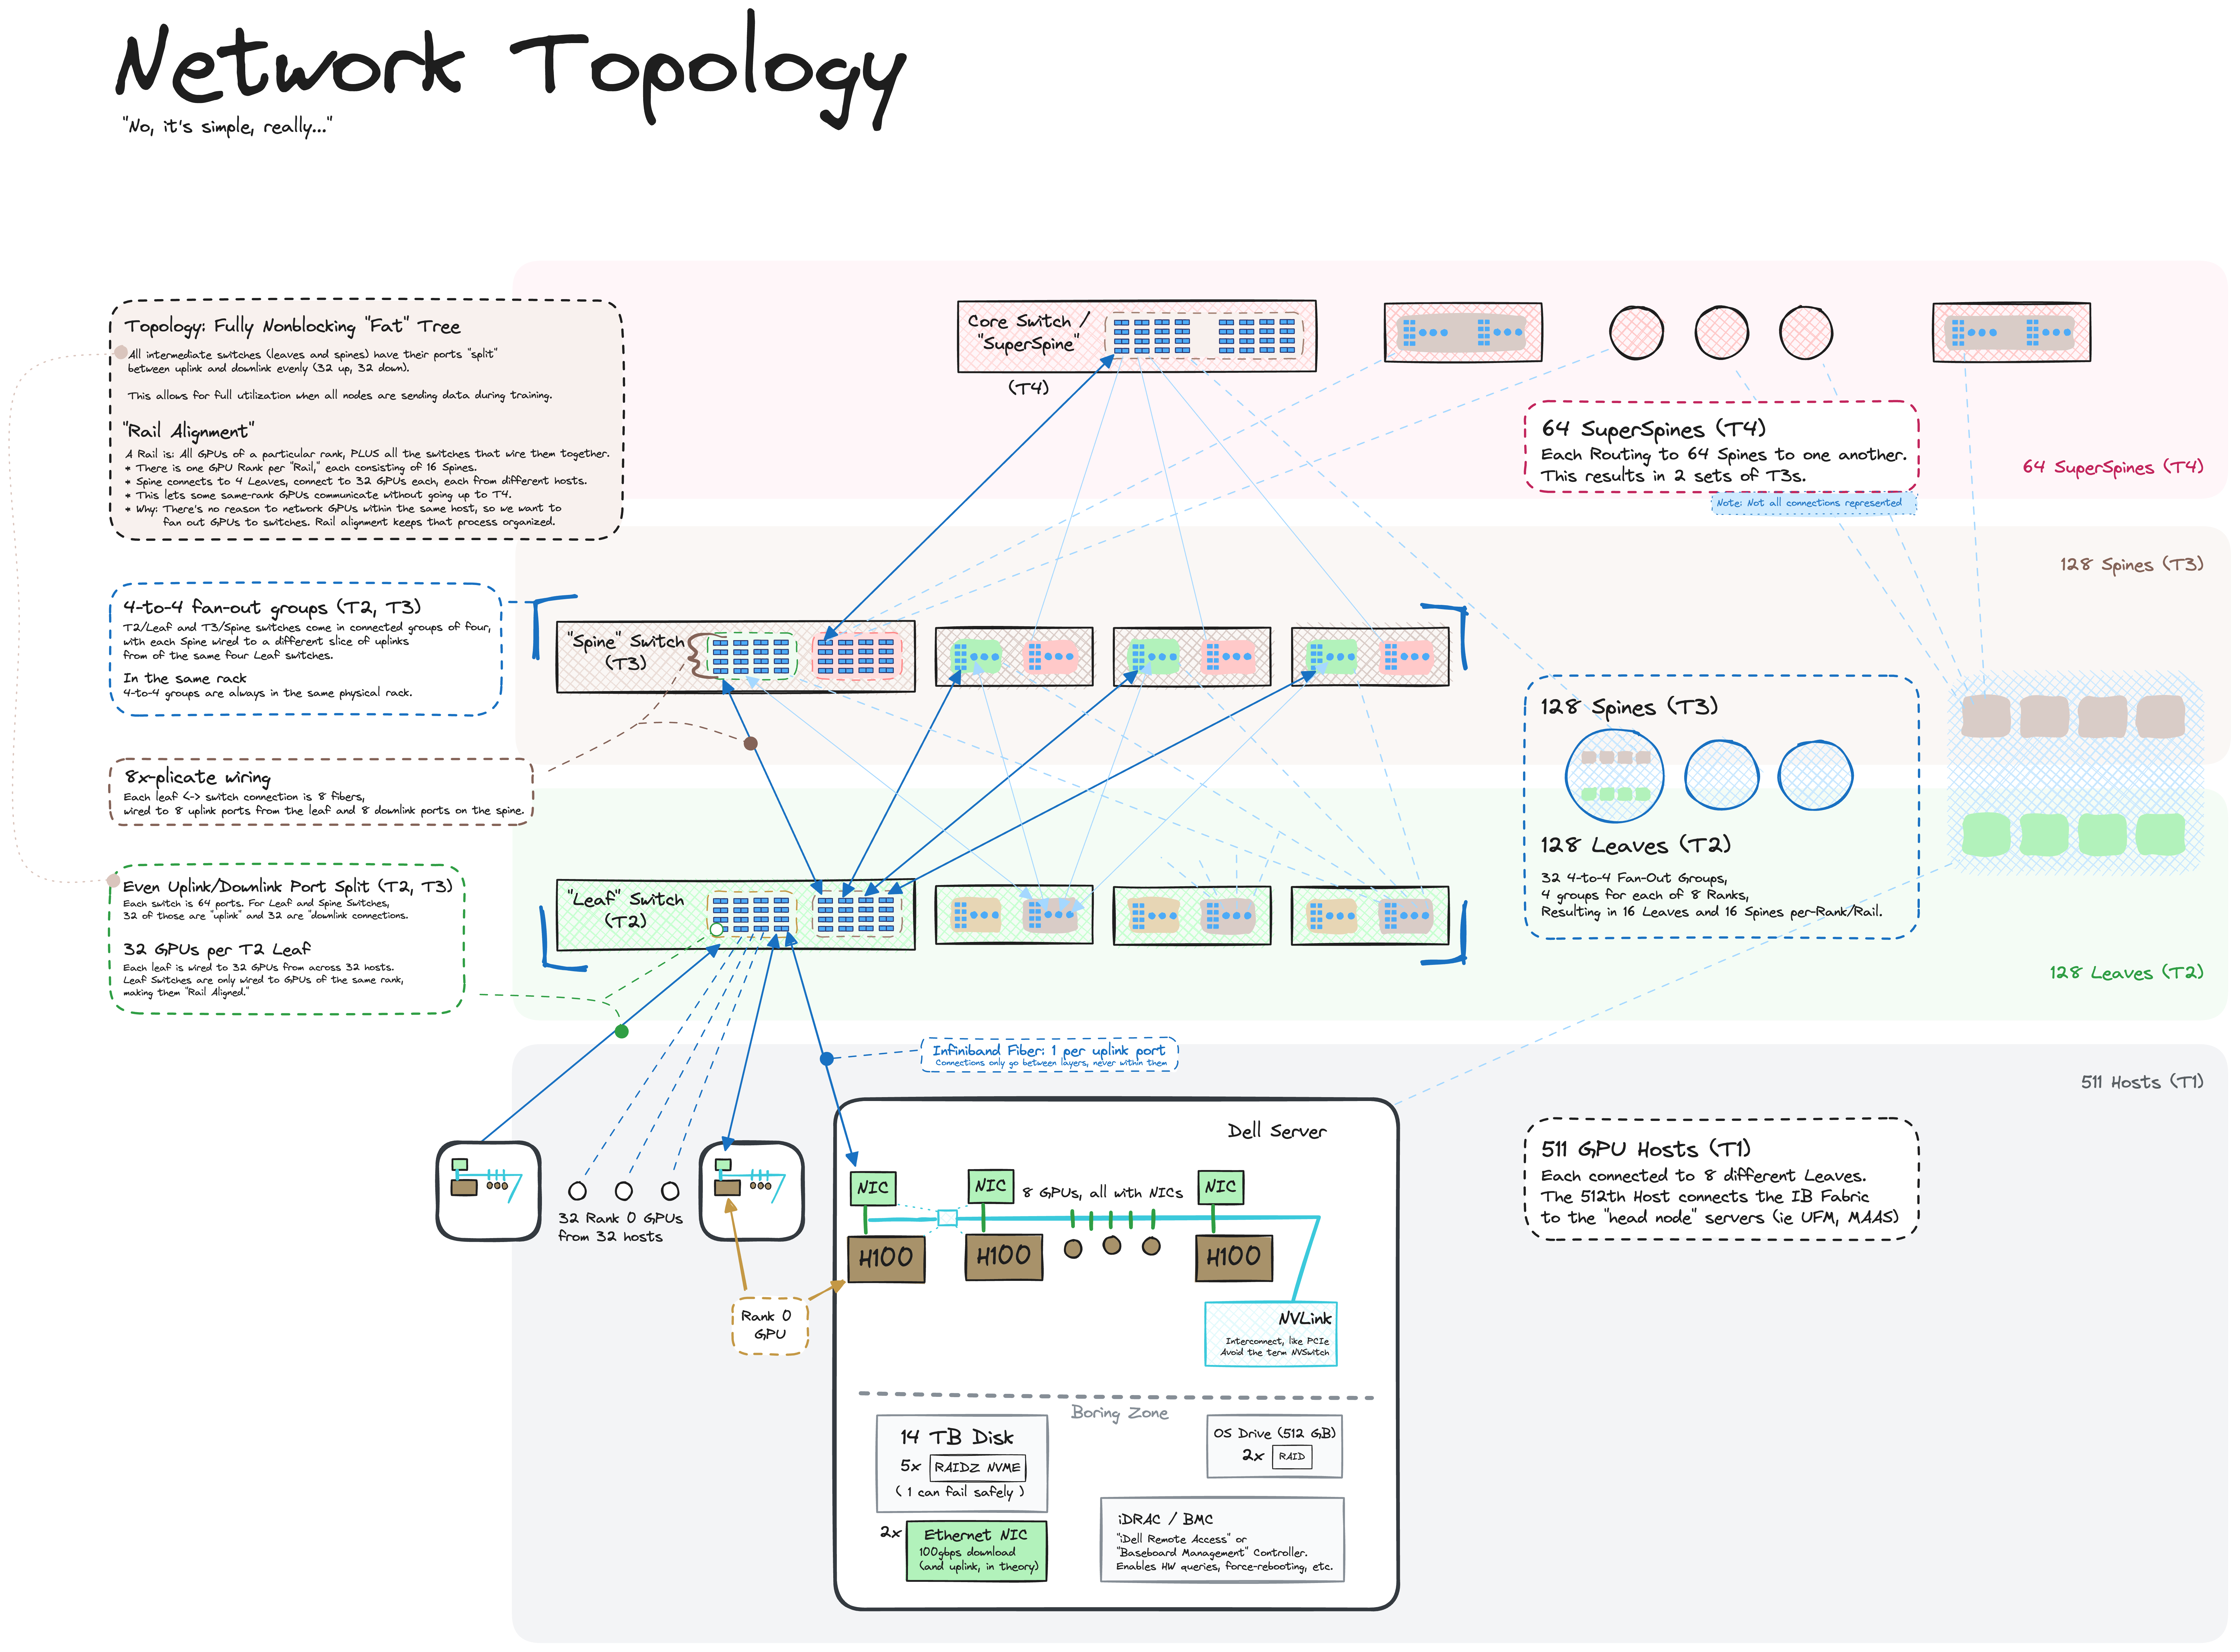
This post focuses on one cluster that had 4,088 H100 GPUs spread across 511 computers, with eight GPUs to a computer. There were 511 computers with GPUs because some connections needed to be reserved for the Unified Fabric Manager nodes, which managed the InfiniBand network. On the 511 hosts with GPUs, each GPU was directly connected to a ConnectX-7 card that could simultaneously transmit and receive at 400 Gbps to any other GPU on the InfiniBand network through its own ConnectX-7 card.
Our InfiniBand network topology was called “fully non-blocking” because every GPU could, in theory, simultaneously talk to another GPU at the maximum rate. This was enabled by a three-tier InfiniBand network architecture: the three levels of InfiniBand switches, when properly connected, enabled this high level of throughput over the entire network. See below for an overview of the InfiniBand network:
Note that the communication for training networks happened over InfiniBand, not over Ethernet. While the machines were also connected to an Ethernet network, that network was used to transfer datasets, checkpoints, and other data. It would have been far slower to send data over Ethernet because data would first travel from the GPU to the CPU, and then out one of the 100 Gbps Ethernet cards. While it would have been possible to train over Ethernet using a technique called RDMA over Converged Ethernet (RoCE), that would require a significant amount of additional work on both the hardware and software side, and would generally be less reliable than InfiniBand (see this paper that outlines the extensive process).
There was also a secondary Ethernet network used purely for configuration and management, enabling access to the controller interface for the basic input/output system (BIOS), power supplies, and other low level machine interfaces. Without this management network, we would have had to manually set up our nodes with a USB drive, keyboard, and monitor, which would not have been not a sustainable approach for hundreds of machines.
Using our cluster for high performance training meant that every component — InfiniBand, Ethernet, GPUs, and the nodes themselves — had to work near perfectly. If even a single one of the over 12,000 connections was a little flaky, it could slow down the entire training run.
The rest of this post details the process of actually getting to a point where everything works perfectly, and ensuring that it stays that way.
Process: How to go from bare metal to a fully operational cluster
Provisioning individual machines
After establishing an initial Ethernet connection to the cluster via the management network, we obtained access credentials to the baseboard management controller (BMC). The BMC is a specialized service processor that remotely monitors a host system and is typically wired to a separate network. It allowed us to interact with every machine as if we were physically present and provided additional APIs for hardware health, BIOS setting, and power management.
With these components in place, we rolled up our sleeves and began setting up the cluster.
Step 0: Getting one machine provisioned
We first used iDRAC (Dell’s baseboard management controller) to install Ubuntu 22.04 on a single server, which would be used to set up everything else. Among other things, iDRAC allowed us to mount and boot off of an ISO image from a local computer, with a virtual console provided in the browser. This would ideally be the only manual installation in this process.
Step 1: Installing an OS on every machine
With patient zero taken care of, we proceeded to install Ubuntu’s Metal-as-a-Service (MAAS) software to help provision the remaining servers. With the Preboot eXecution Environment protocol (PXE) booting and automated iDRAC tools, we instructed every machine to boot off the network and configured MAAS to respond to the PXE boot requests. When performing the initial network boot, servers received an IP from MAAS via a dynamic IP allocation protocol (DHCP) and an initial kernel without needing to have anything installed on the local drives. This bare-bones environment was automatically used to perform a persistent OS installation. In theory, we would wait for the first boot, and everything would be taken care of. In practice, however, the MAAS integration with BMC was not reliable, so we used the iDRAC API to collect the MAC address (a unique physical hardware identifier) for every machine in advance.
Throughout the training process, MAAS was a generally reliable component of the stack. However, we experienced some hiccups at the beginning that were fairly specific to our setup. For instance, during the first few provisions, the clocks were so far off that HTTPS certificate validation issues prevented anything from being installed via apt. Relatedly, because the MAAS server had to take care of so many responsibilities (DHCP server, DNS server for hostname to IP resolution, HTTP proxy between hosts and official Ubuntu package servers, NTP server, cloud-init configuration management, and ground truth database for connecting MAC addresses to IPs to hostnames to custom metadata), we had difficulty tracking issues to the root cause component. Adding to this was the learning curve around the MAAS provisioning lifecycle, as it was designed to handle the complexity of managing greenfield deployments as well as gradual migration of nodes and various debugging/unhealthy intermediate states.
Step 2: Diagnosing broken machines
As is typical in setting up large GPU clusters, we found that about 10% of the machines failed to boot, mostly due to physical issues with the servers. Some issues we encountered included: unconnected or miswired Ethernet cables, hardware issues in iDRAC, broken power supply units, bad NVME (nonvolatile memory express) drives, missing internal wires, and network cards or GPUs failing to show up. We automated checks for these issues, passed some machines back to Dell for re-testing, and filed appropriate tickets for the data center staff. An advantage of taking the cluster setup into our own hands was that we were immediately able to put the healthy machines to use while awaiting maintenance on the others.
Step 3: Minimal viable observable metal
We proceeded to set up the following on every server:
- Docker (for more easily running services and training jobs)
- Data center GPU drivers
- Prometheus node exporter (for exporting a steady stream of hardware / OS metric)
- DCGM exporter (additional metrics from NVIDIA for GPU state / clocks / utilization)
- RAIDZ ZFS pool on all the non-OS drives (this enables machines to survive one drive being down, and also gives transparent compression for free, which is particularly helpful for plain-text datasets and repetitive logs, routinely enabling us to use about 10 times more space than we would have otherwise been able to)
We then ran basic GPU diagnostics to determine whether the GPUs were mostly functional — those that weren’t would typically experience hardware issues within a couple hours.
During this time we ran into some bandwidth bottlenecks when we tried to install software packages across all 400 nodes in parallel. This was also the first time we started to receive heat alerts for high temperatures on various components in the data center deployment. This first batch of heat issues was mostly remediated via firmware updates.
Step 4: Single-node GPU training
The next step was ensuring that every machine could handle real GPU workloads in isolation. Many couldn’t, due to a number of issues:
- GPU-related errors, which were mostly fixed by reseating the cards in their slots: physically sliding out the 200-pound server from the rack, removing all the cables in between the cover and the GPUs, then taking the GPUs out and putting them in again before replacing all the cables and reracking the server.
- A number of the wires between the GPUs and the Peripheral Component Interconnect Express (PCIe) buses or network cards reported “limited width: x4 < x16” according to Ubuntu server logs. After updating the PCIe switch bus firmware, we found that the internal PCIe cables needed to be reseated for around a quarter of the hosts in the cluster — presumably because the rather fragile cables were situated between the casing and the GPUs, which meant that they would be jostled or unplugged any time anyone wanted to do maintenance on the GPUs.
- A number of miscellaneous failures affected single-digit hosts. Dell helped us fix these via firmware upgrades:
- NVMe drives didn’t show up as faulty, but locked up the entire machine when touched.
- Hard drives showing up in random order under Linux, which confused MAAS and caused the OS to get installed on the wrong drive.
- Wrong temperature readings, which caused fans to spin up to 100% all the time. This was caused in part by having a bad NVIDIA driver, which we resolved by downgrading to the previous driver version.
- Dynamic frequency scaling for CPUs going haywire, limiting to 2 GHz on the active cores.
- Direct GPU-GPU communication (GDR, or GPUDirect RDMA Peer Memory Client) was impossible to apply successfully.
Provisioning InfiniBand
Step 0: Installing the UFM
One advantage of InfiniBand was its centralized design, as it has one brain for the entire network. Therefore, we only had to deal with one entity for the 320 network switches in the fabric. Our first task was to figure out which switch connected to which machines, then to correlate that with the wiring diagram and rename the switches by their physical location.
Step 1: Time for rewiring
Initially, the UFM couldn’t detect the 320 network switches, let alone all of the hosts expected to be present on the fabric. After conferring with our data center partners, we confirmed that the switches were powered on and wired in, yet remained undetectable. Upon examining the network wiring list, we noticed that the top level of the fabric was misdesigned: instead of a single unified fabric, we had eight disjointed networks with no common routing paths. After rewiring the connections, we added checks to verify that all the physical connections lined up with the new design.
Step 2: Ten thousand temperature alerts
After resolving the physical wiring issues, the UFM successfully established contact with all InfiniBand switches in the fabric. However, almost every switch port began reporting excessively high temperatures, sometimes exceeding 70 degrees Celsius, even though they weren’t transmitting data yet. We discovered that the issue stemmed from open spaces between switches in the same networking racks, which caused hot air to recirculate back to the front. Our data center partners helped us diagnose the issue quickly and develop a suitable workaround.
Step 3: Eighteen hundred alerts
Many ports also exhibited high error rates or fluctuated between working and broken states, known as “flapping.” These issues only surfaced when the ports were actively used, so preemptive detection proved challenging, as the entire fabric consisted of 10,000 links with a high degree of redundancy. Our data center partners helped clean and reseat alerting ports, and we disabled the remaining alerting transceivers while waiting for replacements.
Although InfiniBand is highly resilient to hardware failures, once about 10% of the fabric began experiencing issues, features like adaptive routing couldn’t function reliably enough to work around haphazardly dropping links.
During this period, we managed to conduct multi-node training runs with 100 to 200 machines. Our process was largely improvised: we sometimes launched on a random set of nodes, observed their performance, and tried to stay running on as many of those nodes as possible. This approach allowed us to find a reliable subset of the InfiniBand fabric, but proved tricky because every time we would change the set of nodes used for training, the default set of InfiniBand links would change.
Step 4: Burn InfiniBand burn, disco inferno
To diagnose InfiniBand issues more efficiently, we devised a specialized workload for the entire cluster that focused on simultaneously pushing as much data as possible through every port on the entire fabric. This was not the same as running one large all-reduce workload across the cluster, which would utilize NCCL to optimize communication within individual nodes by having GPUs communicate using NVLink via Server PCIe Module (SXM) sockets.
Instead, we opted for a brute force approach, and succeeded handily. The UFM began sending alerts about data transmission exceeding 97% of the theoretical capacity through most ports, and some switches temporarily crashed. Every port left standing at the end of the day was deemed robust enough to proceed, and the rest were disabled or handed off for later repair.
Step 5: GPUDirect RDMA
For the GPUs to communicate without incurring CPU overhead, we enabled a feature called GPUDirect RDMA, which allowed direct communication with the InfiniBand network cards. This involved two key steps:
- Enabling an extra kernel module
- Ensuring PCIe Access Control Service (ACS) was disabled to prevent immediate hangs
Step 6: Grow the golden set of servers
A rule of thumb for GPU clusters using the newest hardware: expect about 3% of machines to break every week.
There is a crucial nuance that often gets lost, however: it’s not that every machine has a uniform 3% chance of failing; rather, a small number of malcontent machines repeatedly break in different ways until they’re properly fixed. This highlighted the advantage of having a large number of machines on the same fabric. Instead of playing whack-a-mole on our large training run with random machines, we could instead focus on growing a set of known reliable, or “golden,” machines.
Step 7: Maintenance
InfiniBand maintenance mostly involved responding to UFM alerts, swapping failing cables and transceivers, and occasionally diagnosing more difficult errors, such as faulty switches. Large scale regressions were usually caused by two factors:
- Firmware upgrades, especially if applied to only half of the cluster, which could corrupt the UFM state and necessitate UFM restarts on all of the InfiniBand switches.
- Mass restarts of GPU boxes at the same time, which could flood the UFM state with updates and similarly necessitate a UFM service restart.
Ensuring fully healthy machines
Throughout this process, we discovered numerous ways individual machines could fail or slow down training runs. Many of these failure modes were not immediately obvious, so we wrote a number of health checks to determine which hosts were healthy enough to use for training. We have released the code for these here.
Note that many of these health checks are specific to our runtime environments, are not necessarily related to the base hardware, or are extremely trivial to fix or automate. This is by design: for the overall goal of making our machines ready for training, we wanted a single entrypoint that would answer “yes” or “no,” and would abstract over any number of “trivial” details.
GPU Health Check
We checked that we had the correct number of GPUs, that ECC (error correction code) checking was enabled, and that there were no ECC errors. We also checked that the NVLink topology, which connects the GPUs to each other, was up and error-free.
Disk Space Health Check
We checked that hosts had no more than 95% disk space utilization.
Docker Health Check
We checked that Docker was able to run a container with GPUs attached (i.e. NVIDIA Container Runtime was working properly), and that all Docker containers relevant for monitoring/profiling were active and given the correct host permissions.
Dmesg Health Check
We checked that there were no hardware Xids or SXid errors (faults thrown by the NVIDIA GPUs or inter-GPU NVIDIA switches) in dmesg. We also read out all dmesg log lines to verify that they were all categorizable in a list of “usual/expected log lines”.
iDRAC Health Check
We checked for iDRAC errors on the machine, ignoring non-fatal error messages. This is specific to our Dell machines and is not part of the health checks that we are open sourcing.
Disk Health Check
We checked that zpool was mounted, Docker was connected to it properly, and that it could actually be touched without the CPU locking up.
InfiniBand Health Check
We checked for the presence of increased InfiniBand error rates and/or outdated driver firmware.
Nvlink Health Check
We checked for NVLink errors on the machine. Empirically, this didn’t seem to result in training failures, but it may result in slowdowns.
GDR Health Check
We checked that GDR was enabled on the machine.
VBIOS Health Check
We checked that the VBIOS version of the GPUs, as well as the H100 baseboard firmware were up to date.
Flint Health Check
We used flint and hca_self_test to check that we have the right version of the Mellanox OFED driver, card firmware, and transceiver firmware, and that they were compiled correctly against the NVIDIA drivers.
PSB Health Check
We queried PCIe devices to check that the speed and width of connections is what we expected between the GPUs, the PSB (PCIe Switch Bus), and the network cards. We also checked that the switch firmware was on the current version. This script was developed by Dell and not Imbue, so we are currently unable to share it.
In addition to these quick health checks, we also had a couple of more involved health checks that included:
- Initializing a matrix computation via PyTorch and measuring the NVLink bandwidth and GPU computation speed and memory. We set the proper GDR flags to test both InfiniBand and NVLink.
- Using
ib_write_bwwith–use_cudato send data over the IB cards and measure the PCIe and InfiniBand card bandwidth. We ran this for a longer period (~15 mins) to ensure we caught flappy InfiniBand links. - Running a multinode diagnostic run to check NCCL initialization ability and whether it would randomly stall. If it stalled, our forked NCCL code added additional logging. This could take 12 to 24 hours to detect issues, so we typically only ran this for new nodes, or when we suspected an issue.
- Checking the DCGM exports for any GPU clock throttle events (excluding the expected
gpu_idleandpower_cap). Multinode training that exercised all GPUs, InfiniBand cards, and CPU and disk simultaneously was the best way to exercise these power events.
Diagnosing common training issues
Once the hardware began working properly, it was time to begin training.
In this section, we share some concrete debugging steps and insights revealed through our experience running large language model training jobs on our cluster.
Crashing on startup
In some ways, this was the best error to encounter, because it would (theoretically) be easy to reproduce and iterate on.
We first checked whether we were running our code on the correct version, configurations, and environment variables. While basic, we found that it was critical to ensure that launching training was reproducible and easily inspectable, especially since intermediate abstractions like Docker image caching or opaque secrets configurations could muddy the waters.
Another basic check conducted was ensuring all our machines were online, and that the emitted stack traces or logs could be easily aggregated and inspected. We used a Loki, Prometheus, and Grafana stack, but any suitable log aggregation or tracing SaaS would be appropriate. Due to the synchronous, distributed nature of these runs, often the first error to trigger would cause a cascade of unrelated errors. Here, health checks also helped instantly detect obvious issues such as broken hard drives or missing or invalid GPUs.
We built a system to automatically relaunch on failure, which made log and error aggregation even more important to avoid mixing up errors from different relaunches. Some common errors we encountered included:
- Errors like
Forward order differs across ranks: rank 0 is all-gathering 43 parameters while rank 1228 is all-gathering 1 parameters. We found that this was a quirk of PyTorch Fully Sharded Data Parallel (FSDP) implementation that could be resolved by a relaunch. - GPU Out of Memory (OOM) Errors, that looked like
CUDA out of memory. Tried to allocate …We fixed these by by double-checking our configurations and code, and backing out any recent code changes that might have caused extra utilization of GPU#0 due to improper PyTorch device specification during startup. - CPU/RAM OOM Errors, which were less easily spotted from error logs, and were typically best detected via dmesg logs from the host outside Docker containers. We saw them mostly as
CalledProcessErrororConnectionError, when a forked process or network peer was reaped by OOM Killer invocation. We preferred to just fail health checks and restart the box when an OOM Killer invocation was detected from dmesg. We also checked our code path had a sufficient amount of manual garbage collection (see below sections on how to disable it), and wasn’t accidentally trying to do computations or move tensors on to the CPU.
Crashing in the middle of training
The first order of business was to automate systems that would rerun all diagnostic health checks (see previous sections), then auto-restart the run without unhealthy hosts. We encountered a few random hardware faults, including Xid and SXid errors which could crash the run without emitting meaningful Python stack traces. Some instances, like row remapping, were recoverable by a restart. Others, like uncorrectable ECC errors, often needed hardware maintenance or replacement parts.
In addition, we observed crashes caused by particularly malformed training data. For instance, a very large single document in the corpus could cause OOM errors in either the GPU or CPU. To prevent these, we had a fully deterministic data loader, which made every crash easily reproducible via correlation with the epoch or step number. We found it helpful to disable dataloading or substitute fake data (such as all zeroes) to confirm whether the data was truly the root cause.
Finally, it was also helpful to record network and general node health statistics via any preferred method of metrics aggregation. Issues like Ethernet briefly cutting out or running out of disk space may not show up as helpful error messages, but could be easily correlated with collected data.
Hanging with no stacktrace information (possibly followed by a timeout)
These types of errors were extremely frustrating to debug, due to the lack of helpful information and the fact that they were often difficult to reliably reproduce.
The most memorable type was characterized by error messages like
Watchdog caught collective operation timeout: WorkNCCL(SeqNum=408951, OpType=_ALLGATHER_BASE, … , Timeout(ms)=600000) ran for 600351 milliseconds before timing out
simultaneously appearing across all GPU workers in the training run.
What this meant was that one or more of the hosts failed to complete a NCCL operation, or even crashed out of the NCCL and InfiniBand connection, causing all other hosts to block synchronously on the particular tensor op until the NCCL_TIMEOUT was reached. Unfortunately, the nature of the NCCL library made it incredibly difficult to find which particular host(s) was the culprit.
We made some logging changes to the NCCL library (see our fork here) to better surface which messages or operations were in-flight when the crash happened, and thereby identify which was the host or GPU that seemed to prevent the runs.
Note that in order to identify misbehaving hosts, we often needed to figure out which hosts did not produce certain log messages. The lack of such messages indicated that the workers on that host were stragglers or had crashed.
Other instances of unresponsiveness without helpful error messages could typically be associated with hardware-related issues, such as the aforementioned Xid/SXid/ECC errors causing the NVIDIA driver or NVIDIA docker communication driver to lock up. To distinguish the NCCL hangs from driver hangs and from a race condition or deadlock in Python code, we used tools including Py-Spy and GNU Project Debugger (GDB) to live-debug stalled processes wherever we encountered them. Using this method, we were able to catch one particular issue where, due to a misconfiguration in the Python threading settings, we were unable to launch the eight multi-threaded NCCL GPU processes properly on certain hosts which hit a race condition during pre-PyTorch initialization code.
Training slowdowns (as measured by MFU)
Lack of instrumentation could make these types of issues even more frustrating than the previous category. In addition to breaking out Py-Spy, stack trace inspection, and GDB, we also spun up NVIDIA Nsight and profiling tools to help, some of which were difficult to work with in a highly distributed setup.
Sadly, generic slowdowns or lower-than-previously-demonstrated model flops utilization (MFU) could be caused by a variety of reasons.
First, it proved helpful to double-check configurations, code, and environment variables. We experienced running the wrong model, the wrong batch size, the wrong UFM or NCCL settings, the wrong CUDA_DEVICE_MAX_CONNECTIONS, which all caused suboptimal performance.
We also found it useful to measure instantaneous (i.e. per-batch) MFU rather than a smoothed or windowed average, as the pre-smoothed shape of the MFU curve often helped us diagnose the class of issue. Issues included:
Training immediately started off at extremely low MFU (less than 1/10th of expected) and remained stable
This was most often a hardware issue with the InfiniBand networking, such as a dead switch at the T2 or T3 layer. It could also be caused by hardware issues between the GPU and the NIC, showing up in dmesg as PCIe x16 lanes limited by …
Training immediately started off at 30% of expected MFU and remained stable
This could be caused by one host with improperly set GDR (NVIDIA Peer Memory), or incorrect GDR environment variables.
Training immediately started off at ~60-80% of expected MFU and remained stable
Most commonly, this was caused by degraded or faulty InfiniBand links, especially if a single particular GPU had a faulty associated InfiniBand NIC, causing NCCL to try to route the traffic over local NVLink and use the NIC on another GPU on the same host. It could also be caused by CPU throttling, which required tweaking some BIOS settings for particular hosts.
Sudden drastic dips (by 10x) for single batches that occurred regularly
This was almost certainly related to checkpointing or evaluations — verifiable by checking against epoch or step counts. Annoyingly, this causes many false positives if automated alerting is set just to trigger off of MFU anomalies.
Sudden drastic dips (by 10x) for single batches that occurred randomly and rather rarely (on the order of every 15 minutes), and achieved full recovery to good MFU immediately afterward
This seemed to be most commonly caused by other CPU-heavy workloads scheduled on one of the hosts in the run. Rather than build profiling tooling to identify the particular host, we found it easier to crudely monitor CPU usage by PID. This could also be attributable to sporadically poor networking, such as dataloader bottlenecks. We used metrics monitoring and added Python code timing logs for the dataloading, checkpoints, and any non-NCCL code, which proved quite reliable.
MFU graph gradually sagged downward over the course of a run, but returned to 100% upon any restart
Theoretically, this would be caused by heat accumulation on the switches, but we never saw that. Instead, we used Python and NVIDIA profilers to determine that the degradation seemed to be the result of automatic garbage collection.
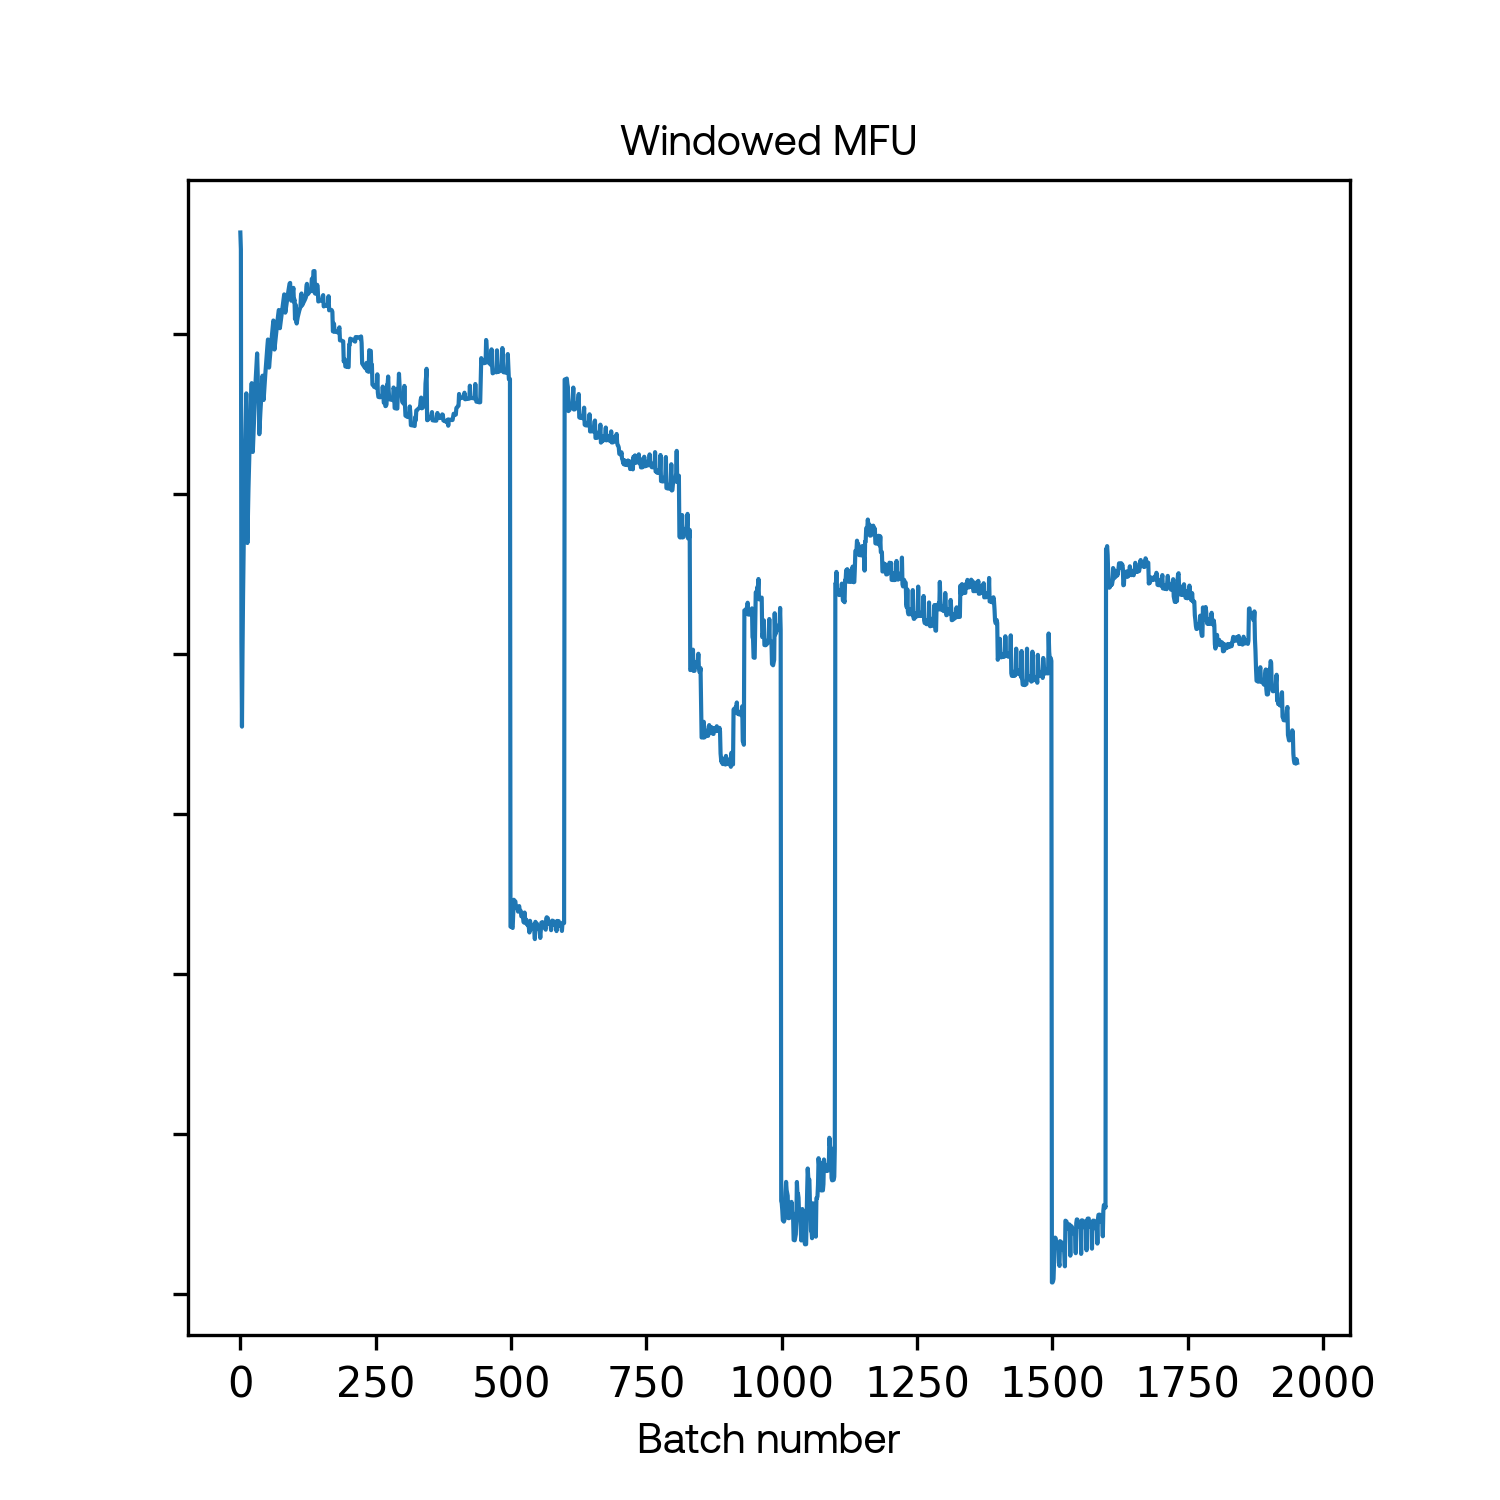
While debugging these slowdowns, we noticed a pattern of periodic dips in throughput that almost appeared deterministic. As the training run progressed, the dips impacted a progressively larger percentage of distributed operations. This led to a hypothesis that the dips could be related to automatic garbage collection, which we validated by profiling and testing. Once we disabled automatic garbage collection and scheduled garbage collection to occur at specific intervals across all hosts, these throughput “sags” disappeared.
We used a synchronous distributed training algorithm, FSDP, which is based on ZeRO-3. During a blocking operation, a single worker process running garbage collection could slow down every other worker. With hundreds of worker processes, this could result in significant slowdowns.
Good performance in the beginning, then sudden dips (to 70% of expected) that persisted at high frequency (every 15 seconds)
We observed this was correlated with NVIDIA GPU “clock throttle reasons,” which we collected via applying the proper settings to NVIDIA DCGM. Heat issues (GPU temperatures or broken/degraded host cooling fans) or power supply failures caused this. Also, some of our hosts with specific power supply hardware had voltage problems when we maxed out all 8 GPU utilization and 8x NIC InfiniBand utilization and CPU/RAM/disk at the same time, but only when all were being used — typically only during an actual training run.
Good performance but a bit “noisier” than usual (high-frequency white noise variance between 90% and 100% of expected MFU)
This was also InfiniBand hardware related, but typically due to moderately degraded or flapping links higher up in the network rather than at the less redundant host to T2 layer.
Unfortunately, many of these issues are not easily pinnable to a particular host, and the InfiniBand-related issues were especially hard to nail down because of the topology-aware nature of the InfiniBand switch technology. InfiniBand seemed to prefer adjacent hosts in the InfiniBand fat-tree design, and the UFM could route packets in ways that would result in asymmetric link speeds.
Here’s a quick summary/flowchart/sanity checklist for debugging throughput regressions:
- Did it ever work?
- Did you change something recently (e.g. merged code, updated drivers)?
- Are you running on healthy hosts? Are all your dependent services running, including third party SaaS, e.g. Docker Hub, GitHub, or whatever else your stack depends on?
- Are you sure you ran with the exact same code, environment, configurations, versions, host list, rank order, random seed as the last time (if possible)?
- Is it reproducible?
- Is it correlated with anything else? Other processes? Daily crontab? Host or DCGM or UFM metrics?
- Are your tools to measure metrics correct?
- Does the issue still occur when running reduced code (smaller model, faked data, no checkpoint saving or loading)?
Improving infrastructure tooling
Upon completing the above steps, one can achieve good performance when training a model…at least until something inevitably breaks.
In this section, we cover a few different tools and systems that we made to ensure that training continued running smoothly, ideally with a minimal amount of human intervention. Because we are a small team, we simply didn’t have enough people to constantly make manual repairs, so we attempted to automate as much of the process as possible.
Almost all of our training run problems could be pinpointed to faulty machines or network components. These failures occur frequently in a large cluster, so it was essential to automate the process of disabling faulty machines and network components and requesting repairs.
Faulty machines
We developed a system for automatically relaunching crashed runs from the most recent checkpoint. The relaunch process would begin by running our health checks on every available machine and classifying each machine’s health based on which health checks it passes; it would then attempt to relaunch the training job on the healthiest machines.
Faulty network components
All the network component failures we observed were detected by the UFM and registered in the UFM event log, so responding to network component failures was just a matter of parsing the UFM log and taking the appropriate action for each event.
The UFM events system is quite complicated, containing dozens of event types. In practice, however, we found that only a handful of events were problematic, mostly related to links going down or high symbol error counts. After identifying these events, we were able to write scripts to parse the UFM event log, disable links and ports implicated in recent events, file maintenance tickets on those network components, and re-enable those components once maintenance was finished.
Local mirror file system
It became obvious early on that one of the bottlenecks to large distributed training runs would be Ethernet speed into and out of the cluster. A shared Ethernet connection with a bandwidth of about 10Gbit/s would quickly become saturated if hundreds of workers tried to download datasets and model checkpoints simultaneously.
As a result, we decided to build a local file system within our cluster to mirror cloud storage and essentially serve as a cache to reduce the number of files we needed to fetch from S3. To deal with cluster churn (machines would often be disabled or swapped out for maintenance reasons) we did three-fold replication of each file, using consistent hashing to distribute load evenly in a way that minimized file movements during churn. Limited disk space on the cluster meant that we also had to develop various tools for keeping track of file lifecycles and clearing out files that were no longer relevant.
Local distributed Docker registry
We also made use of Kraken, a fantastic open source software to enable peer-to-peer transfer of Docker images. We had almost no issues with it, which was a bit surprising given the complexity of both the task and the implementation.
Various performance-monitoring tools
We set up the default Torch profiler as well as NVIDIA’s Nsight Systems. The latter was helpful for understanding exactly how long forward/backward passes and NCCL communications take, and in determining if we were bottlenecked by communications or compute for a given model size and worker count. However, Nsight Systems was somewhat difficult to use, because it required running Docker in privileged mode, disabling security checks related to performance monitoring events, and because saving out the profiles often required stopping the entire training process.
In addition, we found it helpful to write tools to detect slow training batches and understand potential causes of slowness. The most useful of these was a tool which monitored how long each batch took and dumped the stack trace of every worker when a batch was unusually slow - this made it easier to identify specific hosts with subtle hardware or software issues.
Subdividing machine groups to pinpoint faulty hosts
During our first few months using the cluster (when our health checks were not as thorough as they are now), we often ran into a situation where a training run on a specific set of machines was failing but it wasn’t clear which machine was at fault. To pinpoint faulty hosts, we developed tools to make it easy to partition the set of machines into subsets and launch a smaller job on each subset of machines.
For instance, if a job on a group of 48 machines was failing, we would launch smaller runs on six groups of eight machines, and then launch smaller runs on eight groups of six machines. It would often be the case that only a single run would fail on each of these two stages, allowing us to conclude with high confidence that the machine which was part of faulty runs in both stages was problematic.
Reflections and learnings
Over the course of setting up and maintaining our infrastructure, we gleaned a few useful learnings on the overall process:
- Being able to swap out machines for each other is extremely useful. For any given training run we found it helpful to have 10-20% more machines than necessary for the run, so that we could easily relaunch in case of machine failures. Setting up the cluster networking in such a way that every machine is closely connected with every other machine meant that we could essentially use any working subset of the machines.
- It’s worth writing tests and automated solutions for every kind of hardware or software failure you experience, since every issue encountered during training will reoccur. Similarly, for every opaque error message, it’s worthwhile to write tools to make the error more interpretable.
- Reproducibility is the key to good science. One rule we quickly adopted is “change only one thing at a time,” even for the simplest things.
- Trust, but verify. Whenever we introduced an external tool to the process or onboarded a new person, either externally or internally, we made sure to double-check their claims, especially if subsequent steps depended on those results.
Conclusion
Training large language models requires complex infrastructure to even get started. We chose to be heavily involved in the details of the infrastructure set-up both because we believe it is important to fully understand the systems we work with, and because we suspected that it would ultimately prove more efficient. Now, having gone through the full process, we’re very glad we took this approach — it ended up being critical to have full control over our infrastructure and to be able to easily debug problems at every level of abstraction. While this process required extensive supervision and iteration, it allowed us to deeply understand the underlying procedures, build a series of tools to ensure healthy hosts, learn how to automate systems to ensure continual smooth training, and ultimately create infrastructure that has allowed us to rapidly iterate on the training of cutting edge language models.
This infrastructure process exemplifies our approach to researching and building a robust foundation for AI agents: probing the nitty-gritty details, continually improving upon existing processes, and building useful tools and systems that enable our scrappy team to tackle larger challenges.